
You haven't got to spend much time at all managing a Prometheus deployment before you hit the realisation that configuring it can be complex. The configuration files can be large and unwieldy, and upgrades can be brittle.
Luckily the amazing community that has adopted Prometheus as the de facto standard for monitoring cloud infrastructure has got you covered. The prometheus-operator’s Github cites over 400 contributors! That's for the tooling that operationalises Prometheus, not the database itself!
If this is the first time you’ve come across the terminology ‘operator’ in this context, check out here to learn more.
The reason the Operator Framework has become so popular deserves its own blog post, but for now just understand that it's an application that you deploy into your Kubernetes cluster, you configure it with Kubernetes CRDs, and it will deploy and lifecycle your application for you.
To better demonstrate the value that using operators bring, here is an example of a common task we use the prometheus-operator for, updating configuration.
If you would like Prometheus to start monitoring your new Nginx web server, you would need to add something like this to your prometheus.yaml configuration file.
scrape_configs:
  - job_name: "web"
    static_configs:
      - targets: ["<IP Address of Nginx:9090"]
Then as your environment grows, you’d need to continually add items to this list called scrape_configs everytime you need to monitor a new target. Instead of manually managing the configuration, we are going to use the prometheus-operator to manage it for us.
In order to ‘tell’ the operator to update this configuration, we have to create a Kubernetes CRD that comes with the prometheus-operator called a ServiceMonitor.
Here is an example of what one looks like.
apiVersion: monitoring.coreos.com/v1
kind: ServiceMonitor
metadata:
  name: foo
spec:
  selector:
    matchLabels:
      app: foo
  namespaceSelector:
    matchNames:
    - monitoring
  endpoints:
  - port: metrics
    path: /metrics
The prometheus-operator is looking for all ServiceMonitor’s in the configured namespace.
Once it sees one, it's going to do 3 things for us.
- It parses the
ServiceMonitorand translates that into an item for thescrape_config. - It updates the
scape_configlist in theprometheus.yaml. - Then finally it asks Prometheus to reload its running configuration and therefore start monitoring the new target.
This means we don’t have to understand how to write new scrape_config’s or how to reload the running configuration ourselves. All we have to understand is how to write a ServiceMonitor, and the prometheus-operator will take care of the rest.
Let's take a look at a working example of this.
Here is a ServiceMonitor that's going to match a Kubernetes Service with the label app: web.
apiVersion: monitoring.coreos.com/v1
kind: ServiceMonitor
metadata:
  name: web
spec:
  selector:
    matchLabels:
      app: web
  endpoints:
  - port: metrics
    path: /metrics
Here is an example of a Service that this ServiceMonitor would match.
apiVersion: v1
kind: Service
metadata:
  name: web
  labels:
    app: web
spec:
  selector:
    app: web
  ports:
  - name: metrics
    port: 9000
    protocol: TCP
    targetPort: 9000
This Service will then forward our connections to any Pods that have the label app: web assigned to them.
All this so far is great, providing the target that we need to monitor is running inside the same Kubernetes cluster as the prometheus-operator.
An example use case that I came across recently was what if I need Prometheus to monitor targets that exist outside of my Kubernetes cluster. In my case it was a HashiCorp Vault cluster that was running on VMs.
The Kubernetes answer to sending traffic to IP addresses that exist outside the cluster are called Endpoints.
Endpoints allow us to bridge the gap between a resource that wants to address things by the Kubernetes Service, but where the IP address is outside the Kubernetes network.
He is an example of what this would look like.
We are going to start off with exactly the same ServiceMonitor, except in this case we are going to define 2 ports to scrape. 1 for the Vault API and 1 for a node_exporter running on the VM.
apiVersion: monitoring.coreos.com/v1
kind: ServiceMonitor
metadata:
  name: vault
spec:
  selector:
    matchLabels:
      app: vault
    endpoints:
  - port: metrics
    path: /metrics
    interval: 10s
    honorLabels: true
  - port: api
    path: /v1/sys/metrics
    interval: 10s
    honorLabels: true
    params:
      format:
      - prometheus
This is going to match the Service with the same labels. Only this time you’ll notice we don’t have a selector in the spec.
apiVersion: v1
kind: Service
metadata:
  name: vault
  labels:
    app: vault
spec:
  ports:
  - name: metrics
    port: 9100
    protocol: TCP
    targetPort: 9100
  - name: api
    port: 8200
    protocol: TCP
    targetPort: 8200
When we don’t define the selector, Kubernetes expects us to manually define an Endpoints with the same name to match, just like this one.
apiVersion: v1
kind: Endpoints
metadata:
  name: vault
subsets:
  - addresses:
    - ip: 10.10.1.6
    - ip: 10.10.1.7
    - ip: 10.10.1.8
    ports:
    - name: metrics
      port: 9100
      protocol: TCP
    - name: api
      port: 8200
      protocol: TCP
Here is how to confirm that your selector-less Service has correctly matched your manually created Endpoints.
It's bothering me that I have to keep referring to a single resource with a plural noun like
Endpoints, but that's Kubernetes for you.
kubectl describe svc vault
Name:              vault
Namespace:         monitoring
Labels:            app=vault
Annotations:       <none>
Selector:          <none>
Type:              ClusterIP
IP:                10.243.253.122
Port:              metrics  9100/TCP
TargetPort:        9100/TCP
Endpoints:         10.10.1.6:9100,10.10.1.7:9100,10.10.1.8:9100
Port:              api  8200/TCP
TargetPort:        8200/TCP
Endpoints:         10.10.1.6:8200,10.10.1.7:8200,10.10.1.8:8200
Session Affinity:  None
Events:            <none>
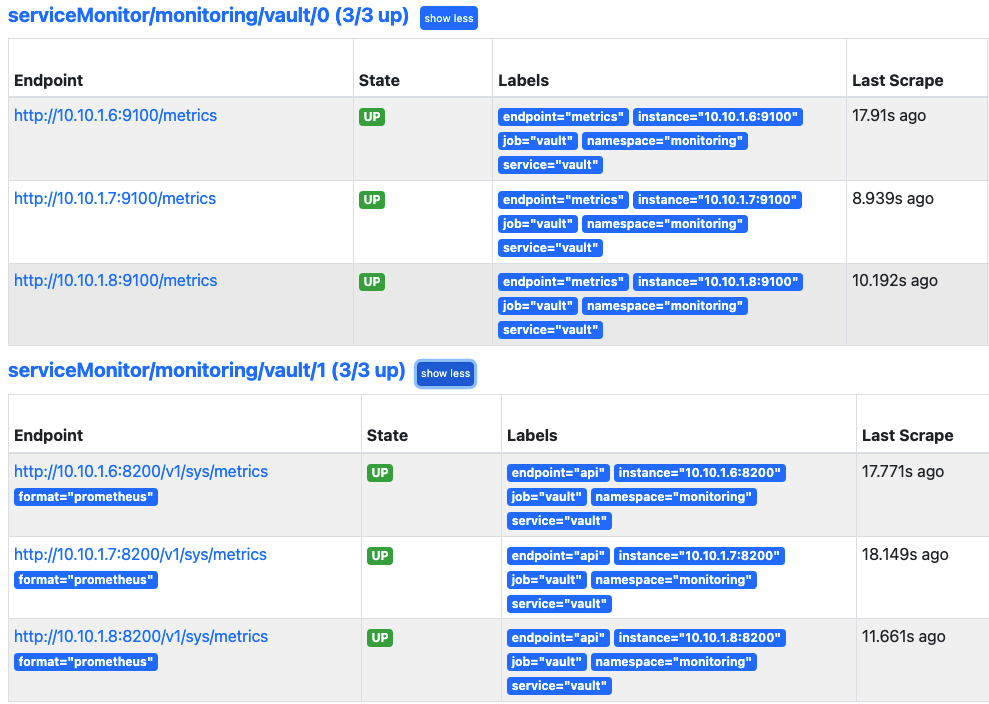
Here is the Prometheus configuration with Endpoints defined as targets.
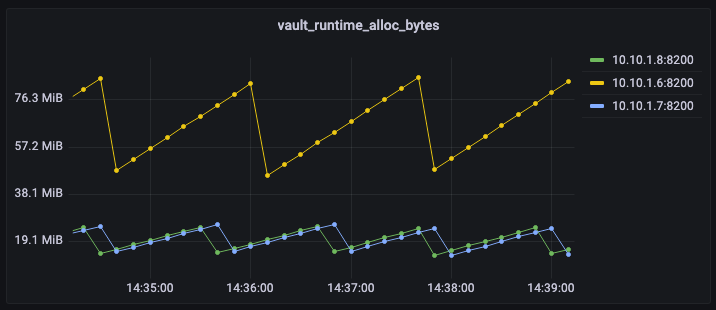
Then finally, here is a quick chart of what some of these metrics look in Grafana.
I hope you found this post informative. If you did and you’d like to be updated when I release more Prometheus and Kubernetes content, follow me on twitter at @jamie_wri.